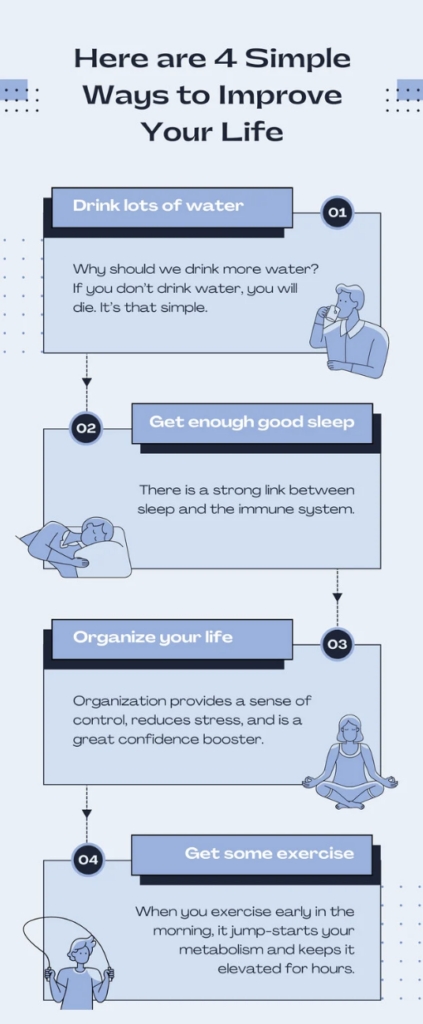
To ensure that learners with visual impairments have access to the same information in an infographic in an online setting, I can make the following additions and modifications:
- Text Descriptions: I should provide alternative text descriptions (alt text) for all images, charts, and graphs used in the infographic. These descriptions should be concise and convey the essential information contained in the visuals.
- Semantic Markup: I need to use proper HTML markup to structure the content. I must ensure that headings, lists, and other elements are marked up correctly. This makes it easier for screen readers to navigate and interpret the content.
- Use of High Contrast: I should choose a high-contrast colour scheme for text and graphics. This helps individuals with low vision or colour blindness to perceive the content more easily.
- Large and Clear Fonts: I must use large fonts for text content. I should avoid decorative fonts. The font size should be adjustable, allowing users to increase text size if needed.
- Simplified Language: I must keep the language and content simple and straightforward. I should avoid jargon and complex sentence structures.
- Interactive Elements: I must ensure that interactive elements (such as buttons or links) are accessible with keyboard navigation, and they have clear, descriptive labels.
- Accessible Charts and Graphs: If the infographic includes data visualizations, I should ensure that I designed them in an accessible way. This might involve presenting data visually and in tables, using text-based legends, and labelling data points.
- Text Transcripts or Descriptions: If the infographic contains complex information, I should consider providing a text transcript or a separate document with detailed explanations.
- Audio Descriptions: For multimedia content within the infographic, such as videos or animations, I should provide audio descriptions or text alternatives for learners who are blind or visually impaired.
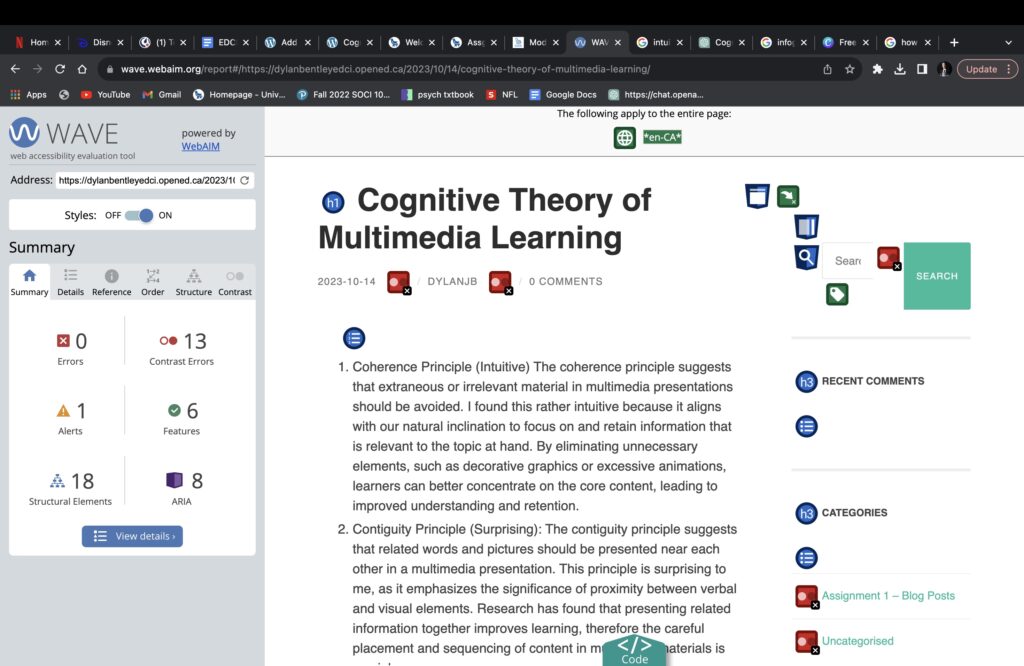
- Test with Screen Readers: I need to test the infographic with screen reader software to ensure that it is navigable and that all text content and descriptions are read correctly.
- Provide Downloadable Versions: I should offer downloadable accessible versions of the infographic, such as PDFs or accessible Word documents, for users who may require them.
- User Feedback: I should encourage user feedback and make improvements based on the needs and suggestions of my audience, including learners with visual impairments.
By incorporating these elements, I can make my infographic content more inclusive and accessible to learners with visual impairments. It’s important to prioritize accessibility in online materials to ensure that everyone can benefit from the information I provide.
wusama1998 2023-10-14
Great points! Your blog post underscores the importance of accessibility in our online content. It’s crucial to ensure that everyone can access and benefit from the information we share. Your practical tips provide a clear roadmap for making infographics more inclusive. I’ll definitely be incorporating these ideas into my work. Thanks for sharing